[How-to] Use the profiler command to identify problematic scripts

Introduction
In a recent update to FiveM, we have a very easy and in game tool which we can use to identify the exact lines of code and threads causing issues within your server!

This can be used both server side, to help find hitch warnings, or client side to improve FPS. This guide will not explain how to fix these issues, simply how to identify where they are so you can tweak and research to fix them

Prerequisites
To ensure profiler works, make sure your client is up to date, and you are using the latest server artifacts. You also need google chrome installed to properly view the profile. If you are viewing the profile without saving first make sure you keep your game / the server open and running!

Usage of the Profiler

Capturing a Profile

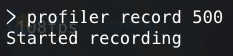
To begin the profiling, open your console (F8 on client, or the server console), and type the following command
profiler record (frames to record)
A good starting point is 500 frames, as this captures things over a substantial period of time. All going well you should see a message which says start

image
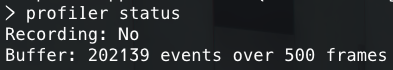
To check the status of the profiler, such as whether the capture is active, and how many frame it has captured, use profiler status. It will display something like this
image
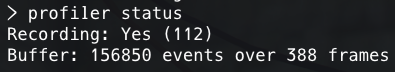
Once the profile is complete, it will display that it is no longer recording
image

Viewing the Profiles

You can immediately view the capture using profiler view, which will open google chrome and begin loading the profile.

NOTE: Viewing profiles server side will not automatically load chrome, you will need to copy the provided link to chrome.

Saving a Profile

You can save a profile by using the command
profiler saveJSON filename.json
This will save a file to the folder where your run.bat file lives.

image

Once you have saved the file, copy it to your computer into a folder you can navigate to easily and complete the following steps

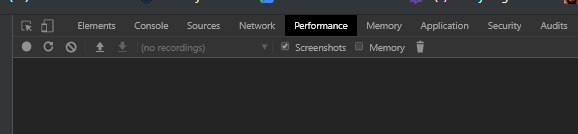
  1. Open a new tab on Google Chrome
  2. Open the dev tools by pressing CTRL + SHIFT + I or Settings > More Tools > Developer Tools
  3. Select the Performance tab

image

  1. Right click anywhere on the panel, and select load profile

image

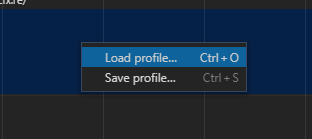
  1. Navigate to the saved file, open it and continue the rest of the guide

Reading the Profiles

image
When you open the profile, you will be presented with a similar screen (I recommend adjusting the size to view it easier).

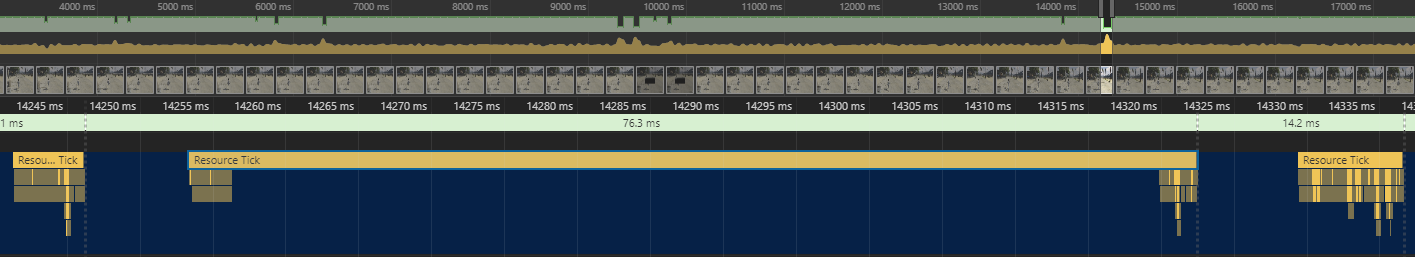
Starting from the top bar, we have the time stamp of the recording, followed by an FPS graph (green) and finally a CPU time graph (yellow, this one is important). This can be used to identify peaks, which correlate to frame drops / micro stuttering or server hitches.

Server Hitch Example

We can identify server hitches by sudden spikes in the CPU time, which exceed normal frames.

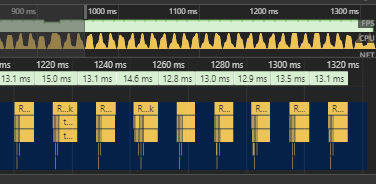
Viewing Specific Frame Information
Scrolling on the time bar will cause the whole display to zoom in on the specific period of time your cursor is hovering on. At this point, you will want to zoom in on specific frames, such as the one below.
image
The information above shows the recording timestamp, the total frame time (green section) and the script threads which executed that frame. Hovering over the frame time also displays average FPS at that time.

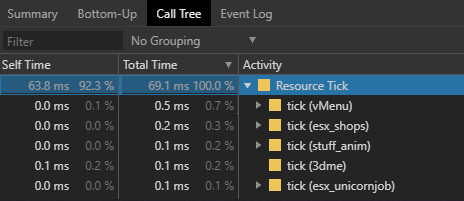
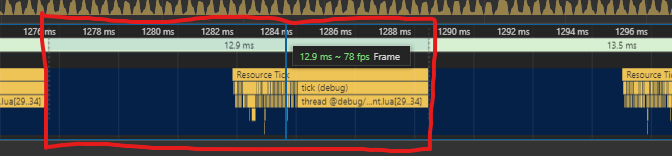
Viewing the resource tick breakdown
Next, zoom on the yellow resource tick event so we can identify what is exactly causing the FPS drop / loss.


In this example, I have a script named debug which has a problematic thread causing significant performance loss. Hovering over any of the events will outline how many ms it is taking to process this thread, and display the file and even line numbers of the thread causing problems.
In this example, it is located in a file called client.lua, on lines 29 to 34.

Hope this helps people, if you need a hand or better explanation of something with the profiler, comment or send me a DM and I will do my best to help

78 Likes

Lovely informative post. Good job :+1: .

2 Likes

Nice, will test it.
EDIT: Works well

1 Like

This is INSANE! Thank you! Can’t tell if I’m being an idiot how do you zoom in? Ctrl + aint working or scroll

Open the URL in Chrome/similar if it opened in a non-Chromium-based browser automatically.

1 Like

Thanks, was on firefox! Brilliant addition thank you FiveM Dev :wink:

1 Like

VERY nice addition and also very useful but it crashes everything (game + Chrome) when I try to view a recording of more than 2000 frames.
Probably not made for so much data I guess?

Keep getting

Malformed timeline data: Unknown JSON format

when viewing 500 frames of server side.

(Think its due to an issue with the cfx.re not replying with the json?) Since directly entering the json link in the browser returns nothing

1 Like

loading as a client saves to bin file but when viewing it will not open anything and as a server the date will not load only shows a 502 error

Hi, I have a litlle question about this way of identifying.
As You can see on my screenshot below the middle tick is taking a big amount of ms but as I understand that’s not a resource fault(because the line below is empty right?)
So what’s the problem then?

Thanks in advance for any kind of help.


Screenshot_116

I’m not 100% sure what causes that, but I believe it was mentioned that it is a garbage collection or other similar problem. Right now I am not sure of the steps you can take to alleviate that, other than fixing the ones you can.

Does this happen often, or only once?

It shouldn’t matter, but do you have webadmin disabled? That could cause the issue. Also are you trying to view the file on a DIFFERENT computer to where the server is hosted?

If it continues to not work, you could always save to a file and then open that locally with your FiveM client

1 Like

nothing shows up when i try this just a blanke chrome thing

2 Likes

I tried saving the file and opening it locally, still getting the same error Malformed timeline data: Unknown JSON format

Edit: Fixed, had to have the server running locally so the cfx.re link was live

Yes, I’ll update the OP with that, I took it for granted.

Alternatively you could save to file, and view that without the game being open.

Omfg… Thank you, thank you, thank you.

After doing some tests this definitely confirmed how shitty of a resource vrp_mysql is lol. And reaffirms my suspicions, now on to the task of completely redoing the mysql backend to this framework so it uses mysql-async :face_with_symbols_over_mouth:

Nice tutorial! My only question is: how do you do it on the server side?

Just use the same commands in server console instead of F8 client console!

When you use profiler view it will provide a link which you can copy to chrome

If it doesn’t work make sure your server artifact is up to date with the latest version!

Good luck

I’m getting the same error as @Robbster (Malformed timeline data: Unknown JSON format) while trying to view server sided profiles. I’m using Chrome and the latest server artifact.

The steps I used :

  • Launch the server locally ;
  • Connect to the server (using the same computer) ;
  • Create a profile using profiler record 500 ;
  • View the profile using profiler view, then opening the link using Chrome and after a few seconds I’m getting the error (while being connected to the server).

I had no problem to view client side profiles.

Any idea on what I could try to or on any info I could provide ?

Same error as above, server is returning:

cfx> alert certifacte_unknown

Guess that be the case why? :thinking:

Newest Windows server artifact (1633) and webadmin resource.