Random heap corruption (regression?) on servers

So i recently (3 days ago) opened a freshly made server and im experiencing some crashes that i really dont understand.

  • Latest server build
  • Gamebuild 2612

Initially all i could see was

[ citizen-server-impl] network thread hitch warning: timer interval of 783 milliseconds
[ citizen-server-impl] sync thread hitch warning: timer interval of 797 milliseconds
> txaEvent "serverShuttingDown" "{"delay":5000,"author":"txAdmin","message":"Server restarting (crash detected)."}"

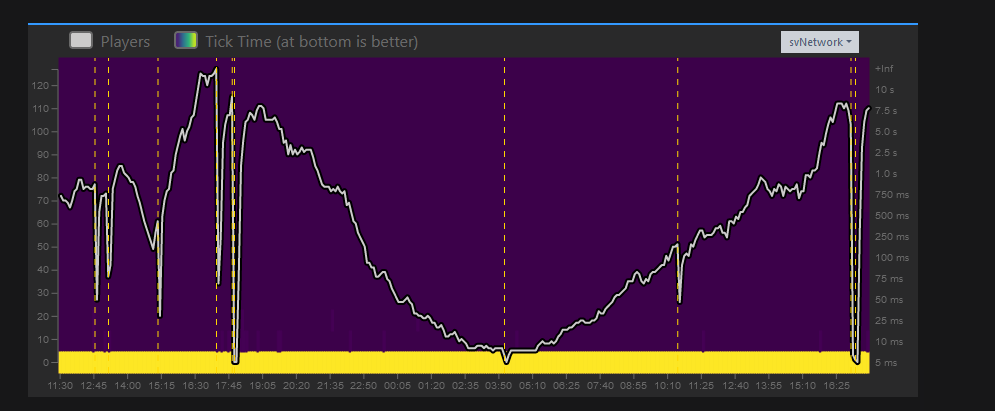
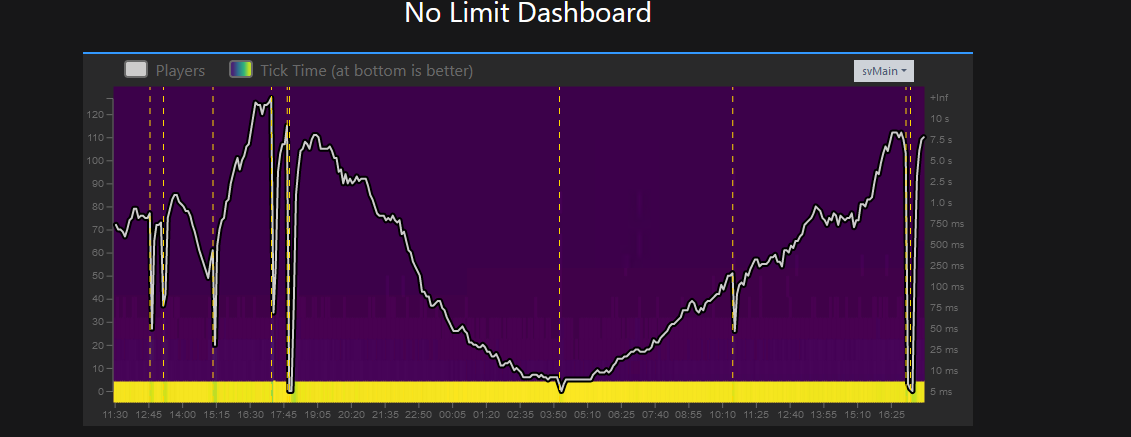
Thoses are screenshots of sync, network and main from txAdmin


I did not get to run a profiler when the crash happens but here a screenshot of the profiler after 6 hours of uptime and about 70 players

On first day i had no crashes at all but a resource called pefcl was runing on dev branch and keep timing out its mysql connection.
After using a release version wich alot of people are using without any issues theses crashes has start to happen.

Currently running the server on ox_core and most of overextended stuff. around 120 resources on the server.
No hitch warning expect for the 2 in the snipet right before a crash. Wich according to tabbara in txAdmin are very much negligeable.
Running phoenix-ac, tried to turn it off wondering if it was the issue but it dosent look like it is.

While monitoring, right before the last crash i saw this

Got a SIGSEGV while executing native code. This usually indicates
a fatal error in the mono runtime or one of the native libraries 
used by your application.
=================================================================

=================================================================
	Managed Stacktrace:
=================================================================
=================================================================
[ citizen-server-impl] network thread hitch warning: timer interval of 1086 milliseconds
[ citizen-server-impl] sync thread hitch warning: timer interval of 1085 milliseconds

I only saw that message once.

The more i search the more i get confused as to what the source of these crash would be.
When looking at pretty much everything i can think of the server looks super stable but then 30 minutes later it crashes.

I think an important point would be that i often crashes right after a start.
Server starts
2/3 player logs in and then server crashes.

At this point im just looking for an external opinion or what i should be looking for kind burning my brain over this.

Any help would be very much appreciated really.

4 Likes

I also have the problem of random crashes for random reasons (once every few hours).
And I did not find a solution
But I downgraded the server build to 5508 and the problem was solved to some extent! But I still have crash every 2 or 3 days

8 Likes

After following the server debugging tutorial in fivem docs here:

https://docs.fivem.net/docs/support/server-debug/

I was able to open and try to understand what im looking at

Every single dmp file was throwing this error:`

Unhandled exception at 0x00007FFE3EFCFEF0 (citizen-server-state-rdr3sv.dll) in FXServer.exe_221227_124505.dmp: 0xC0000005: Access violation reading location 0x000000000030303A

Any help would still be appreciated, regarding those random crashes.

2 Likes

Some more information if someone reads this.
After following the server debuging docs from cfx i can provide this additional information.

I have been collecting dumps and looking at them since 3-4 days, all of them pretty much give the same information.

Exception code: 0xC0000005
Exception information: The thread tried to read from or write to a virtual address for which it does not have the appropriate access.

When trying to ‘Debug with native only’ every dumb throws this error.

Unhandled exception at 0x00007FFE3EFCFEF0 (citizen-server-state-rdr3sv.dll) in FXServer.exe_221227_124505.dmp: 0xC0000005: Access violation reading location 0x000000000030303A

Instead of trying to analyze dump files yourself, especially if you don’t know how, please upload them instead.

Was simply trying to solve my issue, learn and understand but this is clearly over my understanding and required way more googling then i expected.

https://drive.google.com/file/d/11SrQZZr8GM6R6DkijYq50LhrjDMn3Jef/view?usp=share_link

Here a few of the dump i recorded. Thank you for your time.

1 Like

I am having same issue for the last few weeks, all of the sudden, server will restart with only

[ citizen-server-impl] network thread hitch warning: timer interval of 1527 milliseconds
[ citizen-server-impl] server thread hitch warning: timer interval of 1546 milliseconds

Most of the times, there is no dmp file, but I do have few of them pointing at the same line - fivem/lgc.c at f9578a0c545cd8e3f76c7777118e698e1c39a849 · citizenfx/fivem · GitHub

I tried multiple stuff, from disabling resource to fiddling with the firewall and stuff.

Ill upload small dumps, since larger ones are 3,5gb+ (if needed Ill upload them too):
8bfda5e3-c150-4e44-bbac-ae4597513404.dmp (2.5 MB)
6ef89cf7-c73a-4a24-a961-e656305271dc.dmp (2.7 MB)

Any help would be great!

This is likely unrelated to the issue mentioned here, but more like the memory corruption seen in other topics like Server randomly crashing caused by memory corruption.

The annoying thing with that one (or even this one, if it’s the same issue too) is that it seems like an external attack or some ‘obfuscated’ script causing it, and it’s apparently impossible to gather diagnostic information or reproduction steps, and the crash seems timing-dependent and does not occur with a build with memory diagnostics (ASan) enabled.

1 Like

I do understand that maybe this isnt possible, but If there are any ways for me/us to check this, or to provide with server access, or to setup something on the server for diagnostics, somehow capture this.

I do have few pcaps when server restarted but as usual, I am too dump to find anything on it, maybe that would help.

I do think this is the same issue and I guess Plouffe is using windows, windows only shows these hitches and shuts down, while linux usually shows max open files, which from my experience 99% of times is an attack

Anyway, thank you for your your hard work and please do advise if there is anyway we can help

I only have one obfuscated ressource currently running and its an ‘‘Anticheat’’ or call it as you want :stuck_out_tongue:
From ‘Phoenix’ community. 90% of my other resources are escrowed.

I tried disabling phoenix-ac has i dont care so much about an ‘anticheat’ but same thing kept happening. I noticed some weird behaviour coming from it but like i said even with it turned off i get the same issue.

While monitoring i also noticed
Hb:16|Hc:16 Server not responding

Before getting a crash, also lately i get alot of
server is restarting (hang detected).
From txAdmin

Like stated previously everything is in green, everywhere. Server provider (Ovh) does not detects any kind of attack on the server. When monitoring the connection with wireshark yesterday i didnt see anything suspicious.

If this helps you in anyway, i use alot of statebag and most of my vehicles are created using the server setter native. I have alot of sync stuff going on but even then the net event log is one of the best i have seen lately.

Thank you for taking your time looking into this bubbles this really feels like its out of my knowledge.
If you need any more dump or any more information to maybe know where its comming from let me know. If you need anything let me know and i’ll provide it.

Yup, forgot to mention as well. I am using state bags wherever I can, most of the recent resources I made are using both global and player state bags.

Just double checked, these here are the exact same ‘somehow some place in memory is getting "200" written’ thing from the other topic.

1 Like

I might sound stupid but i’ll be honest im a little confused.
Do you think this would be caused internally like i messed up something with one of my script / a script im using or from some kind of attack ?

Anything you would like me to try to help figuring out the issue ?
I personally have no idea what i could try right now, i played with resources trying to see if its cause by one of them but it keeps happening.

Is there something i can do to figure out that ‘somehow some place’ in memory ?

Could this be caused by an hardware issue ?

This is still the most likely scenario, yes. 200 as a string (in one of the dumps even near :status) implies something in the HTTP server logic, and given this might be a fairly specific race condition attack it’s probably not going to show as any unusual amount or pattern of traffic in a quick analysis of a packet dump.

There’s also a high chance that the nghttp2 embedder logic has some flaw with closing connections again - this has happened in the past - which is why it’s a bit of a shame that the actual attack method seems to be unknown so all we can do here is grasp at straws.

Anyway, it’d be appreciated if some of you would try server build 6181, there’s some attempted fixes in this regard there.

2 Likes

As far as my case goes, I updated artifacts FXServer 6181 to the latest version, but unfortunately, we had same crash exactly one hour after the scheduled restart with 1% on CPU and 8% on RAM…

[ citizen-server-impl] network thread hitch warning: timer interval of 1243 milliseconds
[ citizen-server-impl] sync thread hitch warning: timer interval of 1239 milliseconds
> txaEvent "serverShuttingDown" "{"delay":5000,"author":"txAdmin","message":"Server se restartuje: (Server se zaustavio)."}"

However, there are no dmp files at all in the folder :frowning:

EDIT: almost 2 hours in after the first restart and it is no longer occurring, maybe its something about txadmin and its server restart :S

After reading your message yesterday i did as you asked and the issue still persist only difference i saw this time was that instead of getting a Crash detected message from tx i get a Hang detected with the same result AND i saw this for the first time.

And just to make sure i stopped the ‘Ac’ so that way i know its not caused by it.

Im not sure if its a coincidence but i never saw this before using the build. Its possible i missed it but i doubt that.
Might not be related but the server build was the only change i made.

Also i never mentioned that but im runing the exacts same resources on my local dev server and i never had any issue even close to that.
Before opening the server we ran multiples tests sessions on the live server and never had an issue either.

This started happening 2 days after the server opening and kept happening since.
Also it happens with 0 players in the server.

Been monitoring trafic using wireshark for like 3-4 days and i didnt see anything special. Ovh’s permanent mitigation mode also is enable for what its worth.

Considering all this information im pretty sure someone is abusing something we are missing and that something is clearly out of my knowledge to find.

I’ll keep monitoring and trying to note every detail i can, sorry if im adding useless information.
If you need me to try anything just let me know.

Does this ‘hang detection’ have the ability to execute a command (e.g. another procdump execution) when it hangs, or does it restart before the built in crash handler actually saves a dump?

I removed the crashes folder yesterday when switching to 6181, the server crashed once and i have one dmp file in the folder but it starts with livedump-.

So i would say the built-in crash handler does have time to save a dump. Do you want me to send you that dump ?

I currently im not running the external procdump has explained in the cfx docs but if you need me to i will.

I believe live dumps have some wacky stack traces but uploading it might provide a hint anyway.

1 Like

https://drive.google.com/file/d/1TrKbFZXJYccubo08C1mZ_ouSRrZShuDf/view?usp=sharing