Can anyone please help me to run the bin file on my local computer? I need the profile from my server, when we got +70 player the server has performance problems. Can anyone help me to open the .bin file on a external computer? I am able to connect per ssh but I dont know how to connec this to my Chrome :(. I would be thankfull for any help.
Hey, same problem here, “Malformed timeline data: Unknown JSON format” while using profiler view with my cfx link or same while “load profile” on chrome using linux server and i register my file.bin register by “profiler record 500” & “profiler save file.bin”, need idea here guys, nothing working, had no problem 3 days ago and nothing is working right now, i didnt change anything, i wasnt working on my server so…
Hey, i am back because i found a way to fix the “Malformed timeline data: Unknown JSON format” on linux FXServer (distance, not in localhost).
So, basicly u will need to follow the step mentionned in the tutorial(profiler record X + profiler status + wait while record status is NO), and then make a “profiler view”.
At this moment, if the link given for chrome doesnt work and the profiler save neither, u will need to :
open the link “http://x.x.x.x:30120/profileData.json” in ur browser.
So for the link (x.x.x.x = ur IP server) & (30120 = ur PORTS fivem server, both are in server.cfg)
Next step is, u will found something like this :
![]()
Do CTRL+a to select all the code lines and then a CTRL+c to copy all the code.
Open ur text editor and then open a new file, CTRL+v to paste all the code in the new file.
After that u will need to register (save) the new file in format as .json ( for exemple : myfile.json ) and finally u are going to chrome and then with the Chrome dev tools provided in this tutorial, u can now right click “load profile…” and then choose ur “myfile.json” where u save it and tadaaa, it will open and load all ur ticks from server register with profiler record X.
Hope it can help people, i was searching for a solution during 4 days so, enjoy guys.
24 Likes
Hi everyone, I’m Brazilian so I’m sorry for the English. I just found a solution and decided to help everyone with the JSON problem, and it is actually quite simple to solve, here is the process:
Run the ‘profiler record 1000’ commands on your computer hosting the city, you can record as many frames as you want. After finishing use the ‘profiler view’. It will generate a new link, you will copy this whole link and play in the browser. However it will present a 404 error. Now you must edit the link, example:
How it will appear:
https://frontend.chrome-dev.tools/serve_rev/@901bUqcHCfmkmkE1f9HU3LuU3pozaYeUsZ61006/inspector.html?loadTimelineFromURL=https://recovery-city-6l234d.users.cfx.re/profileData.json
How it should look after edited:
https://recovery-city-6l234d.users.cfx.re/profileData.json
Paste this into your browser and it will generate a complete code page. Copy all the code and paste it into the notepad and save it as ‘name.json’.
Go to your browser (chrome), press f12, click performance, and upload the file. Done.
Hope this helps.
2 Likes
Can you help me. My vrp_mysql is having really big ticks, but it only has sometimes. 
1 Like
Great post! Thank You So Much!
Hey guys,
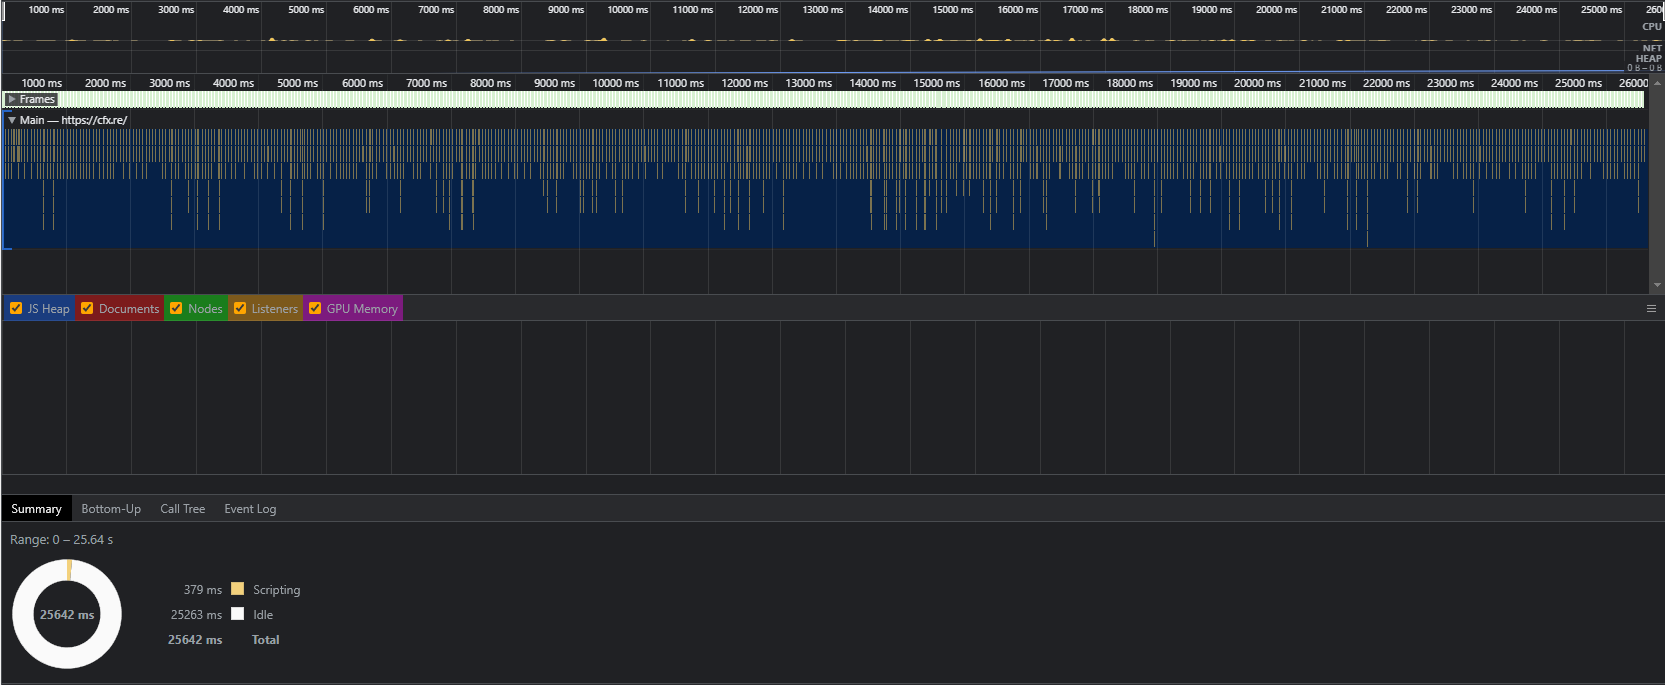
do you think getting 6ms tick is normal?
my chart looks like this but my server crashes from time to time under a 4GB, 2vCPU VPS with only 160 resources and minimal streamed maps and EUPs ( around 1GB of maps, clothes, and cars in total ):

Do you think it’s a resource problem or simply the linux VPS couldn’t handle a 20-players FiveM server?
1 Like
Thank you so much! 
Thank you, your my hero!
Hello
I get this, but I really don’t know how to fix this, if someone can tell me, I have a big problem that when I have 20 player lag,

So, I tried using this - as I recently started getting thread hitch warnings in my console.
However, when I go to view the json link, I get this error on the website:
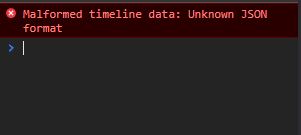
Anyone else have this problem or know how to fix it?
Update
I saved the .bin file to my server, then copied it to my desktop. Tried opening the physical file via the tool - but still get the same malformed error.
1 Like
It needs to be opened in Google Chrome.
- Even if you use a chromium based browser it’ll give you a “Malformed timeline data”
What I do is set my default browser to Google Chrome within Windows.
Then what I would do is record for around 500 frames.
After that, you can check with profiler status to make sure recording has stopped. After that you can do profiler view it may take a couple of seconds to build and automatically open.
You should be good after that.
2 Likes
I get the same issues, I’ve tried several chrome instances including the ingame chromium tools.
I was able to get mine to work, by leaving ZAP lol.
Was that the actually issue - probably not, but yea now it works every time I run it, which has allowed to REALLY optimize my server for ticks.
2 Likes
I don’t believe this works any more, the output simply won’t open.
Nice i will try it out
Is there any way to see in detail within a thread? I’m trying to optimize a resource that has a single thread with over 1K lines of code with a crapload of if-statements. I’d like to be able to identify which natives are eating up the most CPU. It’s starting to look like I may need to rewrite this from the ground up if I can’t determine the problematic parts.
Not that i am aware of. If think your best solution is to lighten the thread in multiple function, and see what “eat” the most ressource.
Never actually thought of that, I feel dumb now. lol
It’ll be a major pain to restructure, but probably the only solution other than rewriting the script. Although I could perhaps comment out sections and see how much CPU time it frees up. I may actually try to rewrite it with proper NUI instead of the DrawText() natives, as I already suspect they’re what’s eating up ~90% of the CPU time used by that resource.