Hi there, I’ve encountered an issue that so far can’t seem to find relative guides how to trace & find the root of it.
Just to be clear, I’m looking more for other server owner’s advice how to trace such issues and prevent them rather than help to resolve it.
So my server crashes approximately once a day on random time due to:
[9464:0000024B0F1E6A10[  c-scripting-v8node] Error: V8 error at Reached heap limit: Allocation failed - JavaScript heap out of memory
] 36139026 ms: Mark-sweep (reduce) 1397.9 (1447.1) -> 1397.4 (1447.1) MB, 898.0 / 0.1 ms  (average mu = 0.520, current mu = 0.002) allocation failure scavenge might not succeed
[9464:0000024B0F1E6A10] 36139927 ms: Mark-sweep (reduce) 1397.9 (1447.1) -> 1397.5 (1447.3) MB, 898.3 / 0.0 ms  (average mu = 0.348, current mu = 0.002) allocation failure scavenge might not succeed
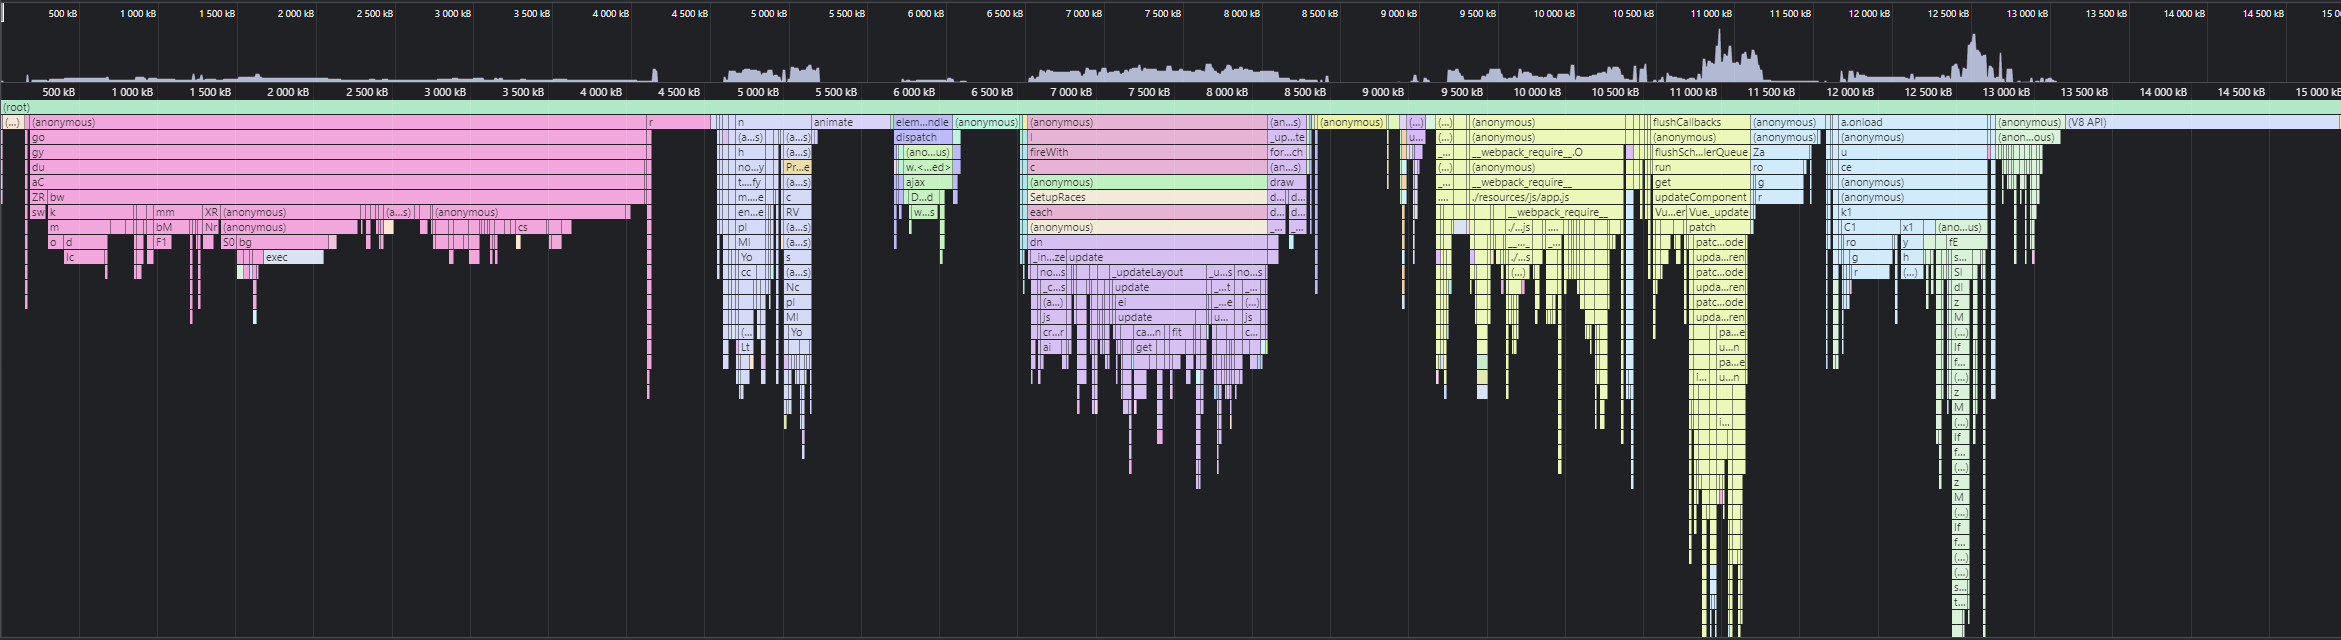
And I also recorded memory trace on that day, where I had ~80mb/s at that time, but I cant seem to figure out what is causing it. Mybe there are some good tutorials or guides how to use Dev tools memory profiler efficiently to track the issue?
I’ve attached my trace to this post so anyone interested can take a look and assist with relative information where to start searching for answers?
Heap-20220908T201153.heapprofile (372.8 KB)
Any information will be much appreciated - thanks