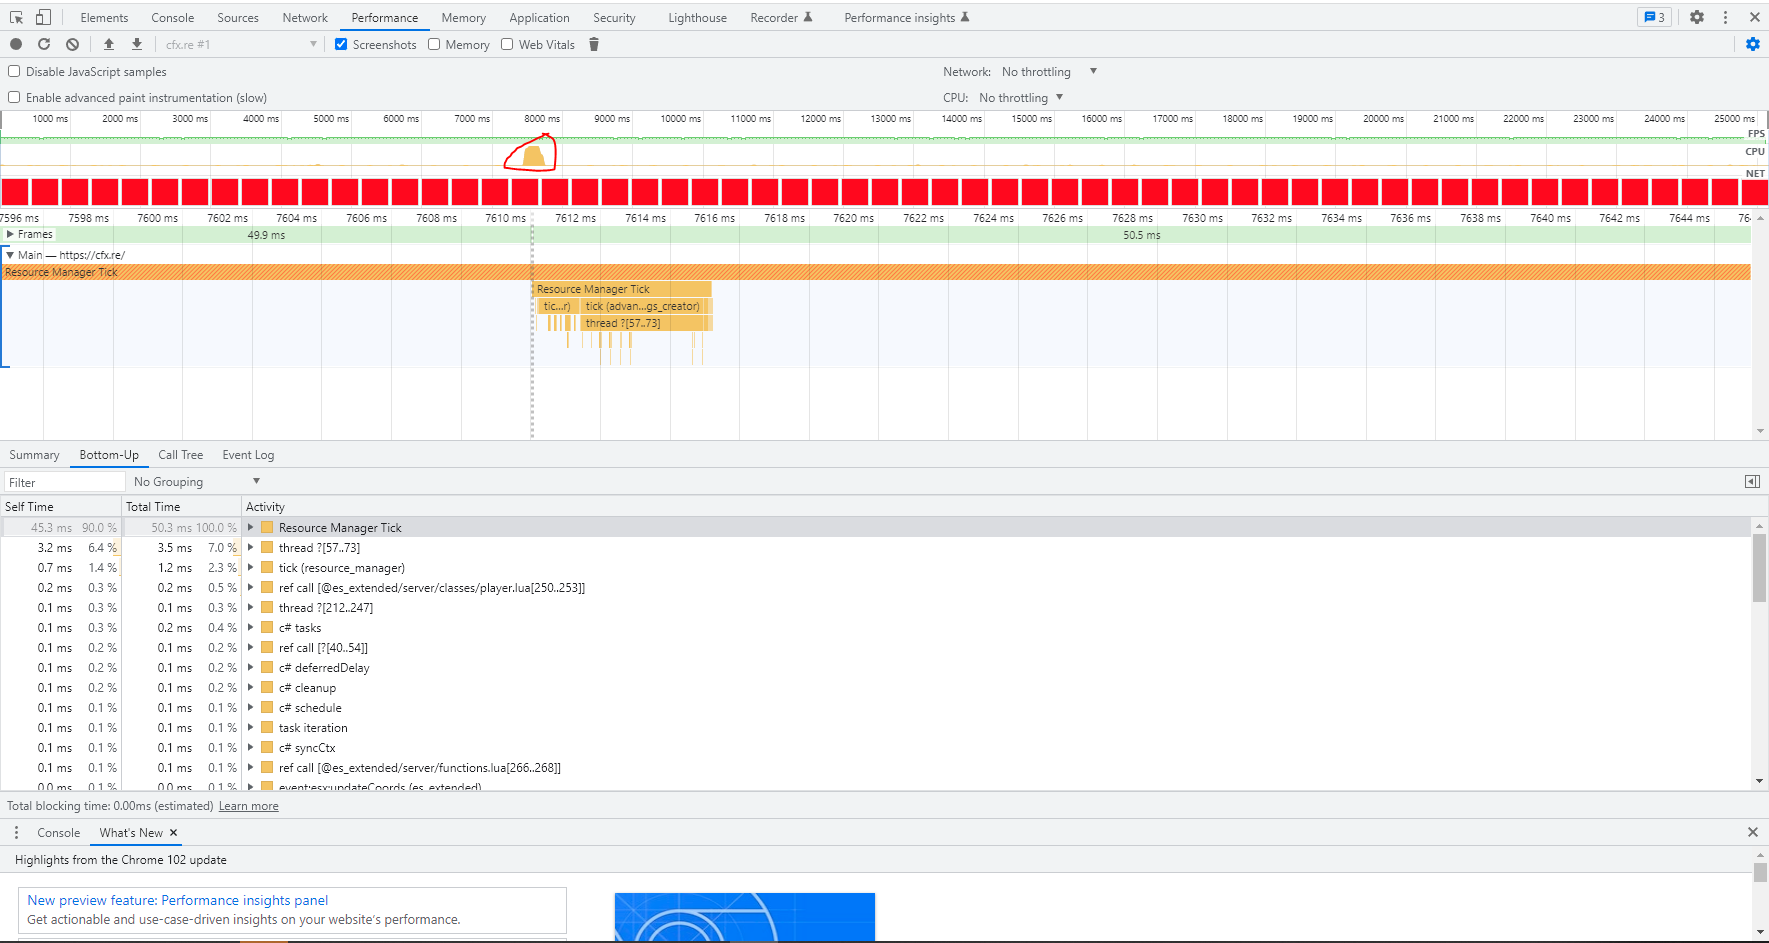
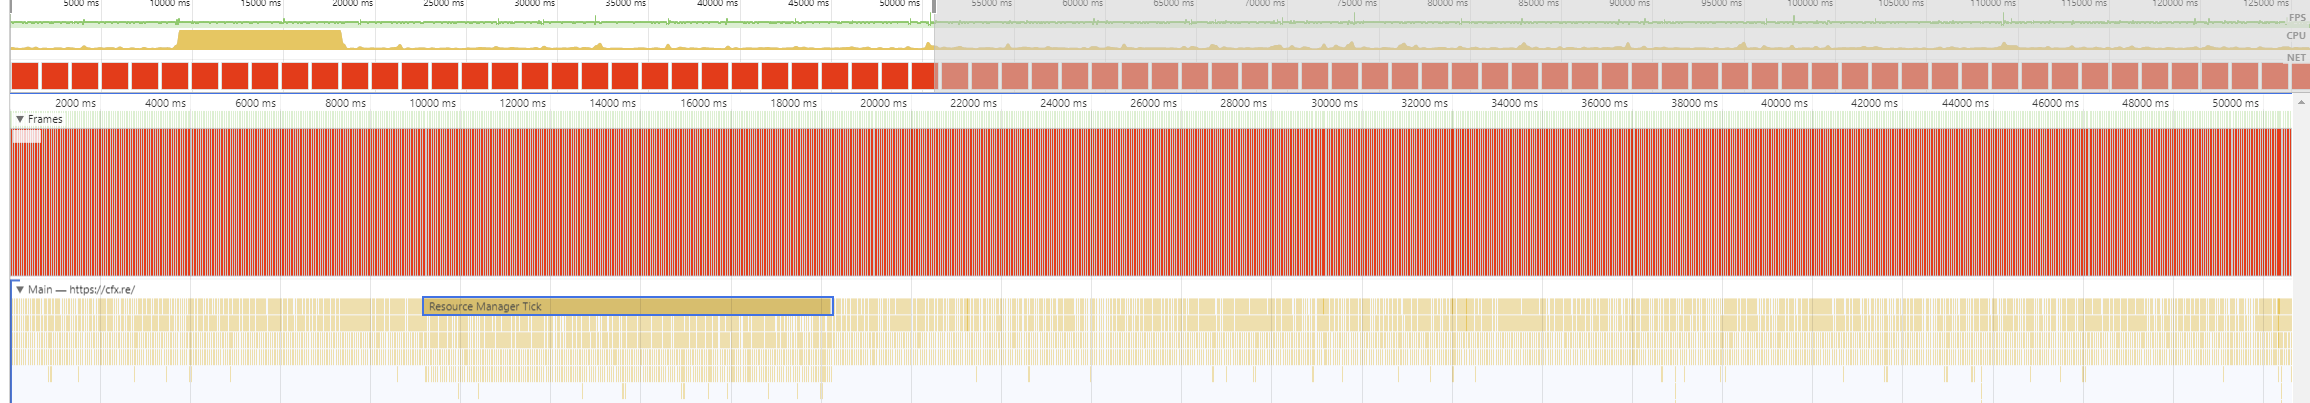
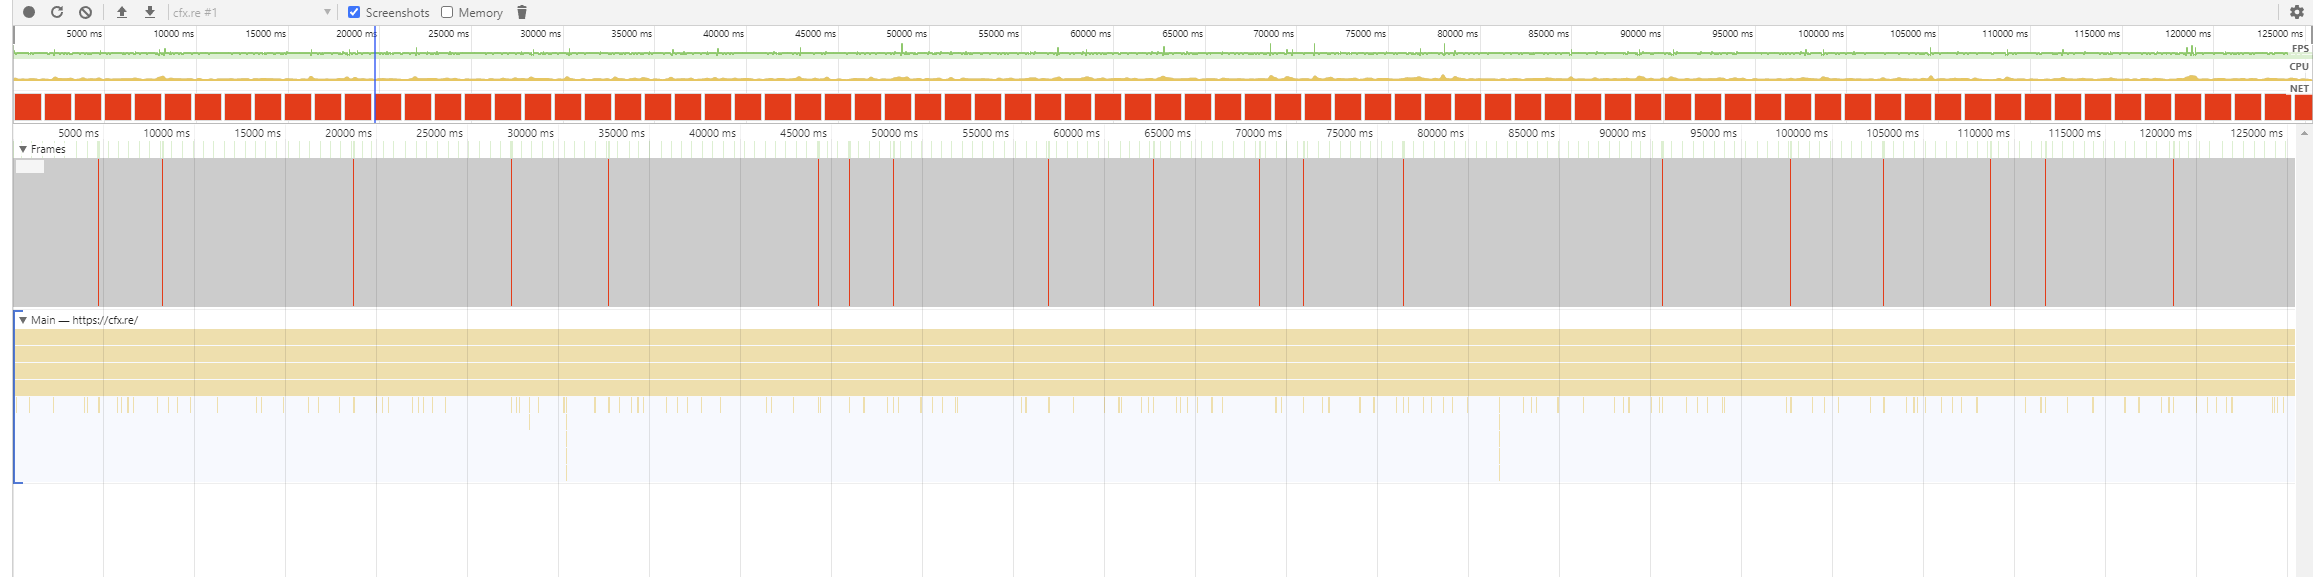
Pretty sure this is a bug on FX5562, when using the profiler from a server and loading json into chrome or edge it often will show a really weird “tick” of about 500ms. Inside of that tick it follows the normal pattern of previous ticks buck resource manager shows it encompassed in a 500MS tick. I’ve attached the profiler data as an example.
Looking at the provided profiler data it seems like the first Resource Manager Tick isn’t being closed, probably due to a missing scope closer somewhere. Though another weird thing is that it is still being closed later on.
I take it you are not experiencing any freezes/delays during this? It looks like it’s doing its normal business in the mean time.
Looks like the issues start and stop around the tick (advanced_drugs_creator) and/or any of its children. I’m inclined to believe a scope isn’t consistently being closed in here, maybe a return, Wait oslt?
I’m trying to explain to the dev why this may happen?
It’s clear when it’s off that it doesn’t.
What would be some practical stuff he/she could look for in their code that would cause this?
The explanation would be that the same amount of scopes that are opened should also be closed in the same frame.
My first guess would be an async method that’s calling Citizen.Wait() before closing the scope it opened before, leaving one scope not to be closed. But it could as well be a return that doesn’t close the scope, for example.
You can use the profiler data to find the scope that changes the pattern and leaving a scope unclosed, that’s also what I used to find which resource did improper management.
I found out the resource causing the issue, they stated the following.
If its just a visual bug due to scopes there’s not much that can be done about it.
The profiler scopes have no effect on the actual server, its solely for the profiler
Pac uses scopes as intended, it’s most likely a fivem issue with how it uses them, I will remove them but it will remove pac scoping
I’m not really sure how to respond to this, they’re saying the issue appears to be on your end.
The claim they’re making doesn’t really make sense - if it’s using scopes ‘as intended’, the scopes would show correctly fine, and similarly, they’re making a lot of contradictory claims in the same message.
Can you get them to provide some code here as to how they use scopes so we can check if it’s actually an issue with ‘using scopes’, or send the code yourself?
Similarly, what does ‘pac’ and ‘pac scoping’ mean in this quote?
Great, if they can give us a minimal repro then we can have a look as well.
Only the profiling itself adds some overhead. It just records/saves start and end times per scope, processed at the end of the profiling, and then visualized by chrome. I can see your normal routine every update/tick, when that was messed up as well or when you actually see your CPU being utilized more then I would start to worry. But then still it might be the script.