Thanks again for the quick response. Setting up the prometheus server was the easy part.
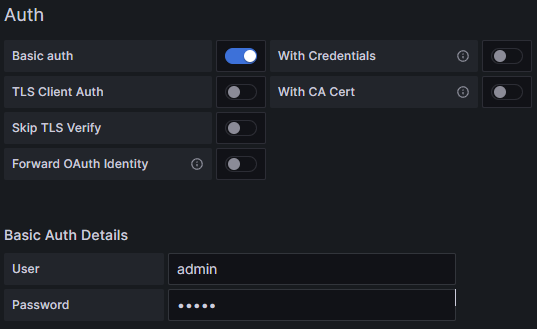
I tried those convar values and it seems to be ignoring it. If I do it without basic auth, I still get the results? If I do it with basic auth, I still get the results. Seems to have no affect?
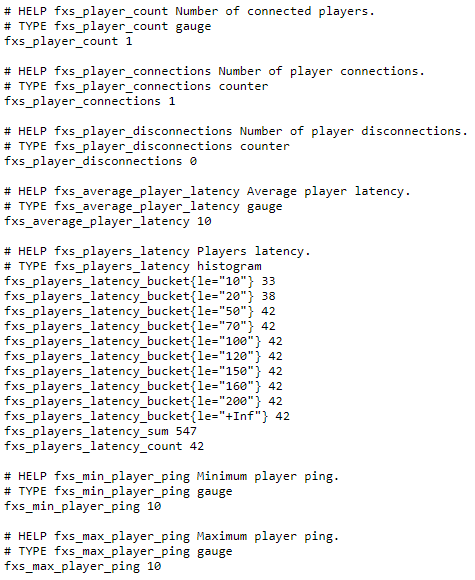
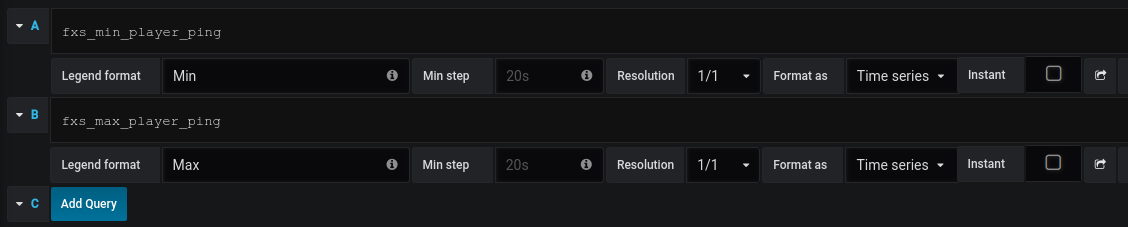
@Hellslicer Would you be open providing the metric queries from Grafana for the demo graphs you show above? I have some but trying to work out the histogram and latencies min/max, etc.
Again, I see some of it. But I think I am getting my grafana metric queries messed up?
Just do a search for prometheus docker images and then you will need to set up a reverse proxy, such nginx as well. Use docker-compose to wire it together.
Hi im getting this error how to fix?
Creating script environments for fivem-prometheus-0.1.0
Error loading script index.js in resource fivem-prometheus-0.1.0: Error: Cannot find module ‘prom-client’
stack:
[object Object],[object Object],[object Object],[object Object],[object Object]
Failed to load script index.js.

 I might need some more hands on than that because I have no idea what you said, I can pay you for your time.