1of1 Profiler & Crash Analyzer
If you’ve run a profiler on your FiveM server before, you know the JSON file it produces is basically unreadable without Chrome DevTools. We built a tool that does the reading for you.
Free, no account needed.

How to use it
Run these two commands in your txAdmin console:
profiler record 300
profiler saveJSON myprofile
Download the saved file from your server’s resources folder and upload it to the tool. That’s it.
FiveM records execution time for every script at the runtime level so no changes to your scripts are needed.
What you get
-
Performance grade based on your average script time per tick and how often your server goes over the 25ms script budget in a single tick. FiveM runs at 20 ticks per second. Scripts should be well under half of the 50ms tick budget.
-
Frame timeline showing every tick as a bar. Green is fine, yellow is getting close, red means that tick was heavy. Hover any bar to see which resources ran during it.
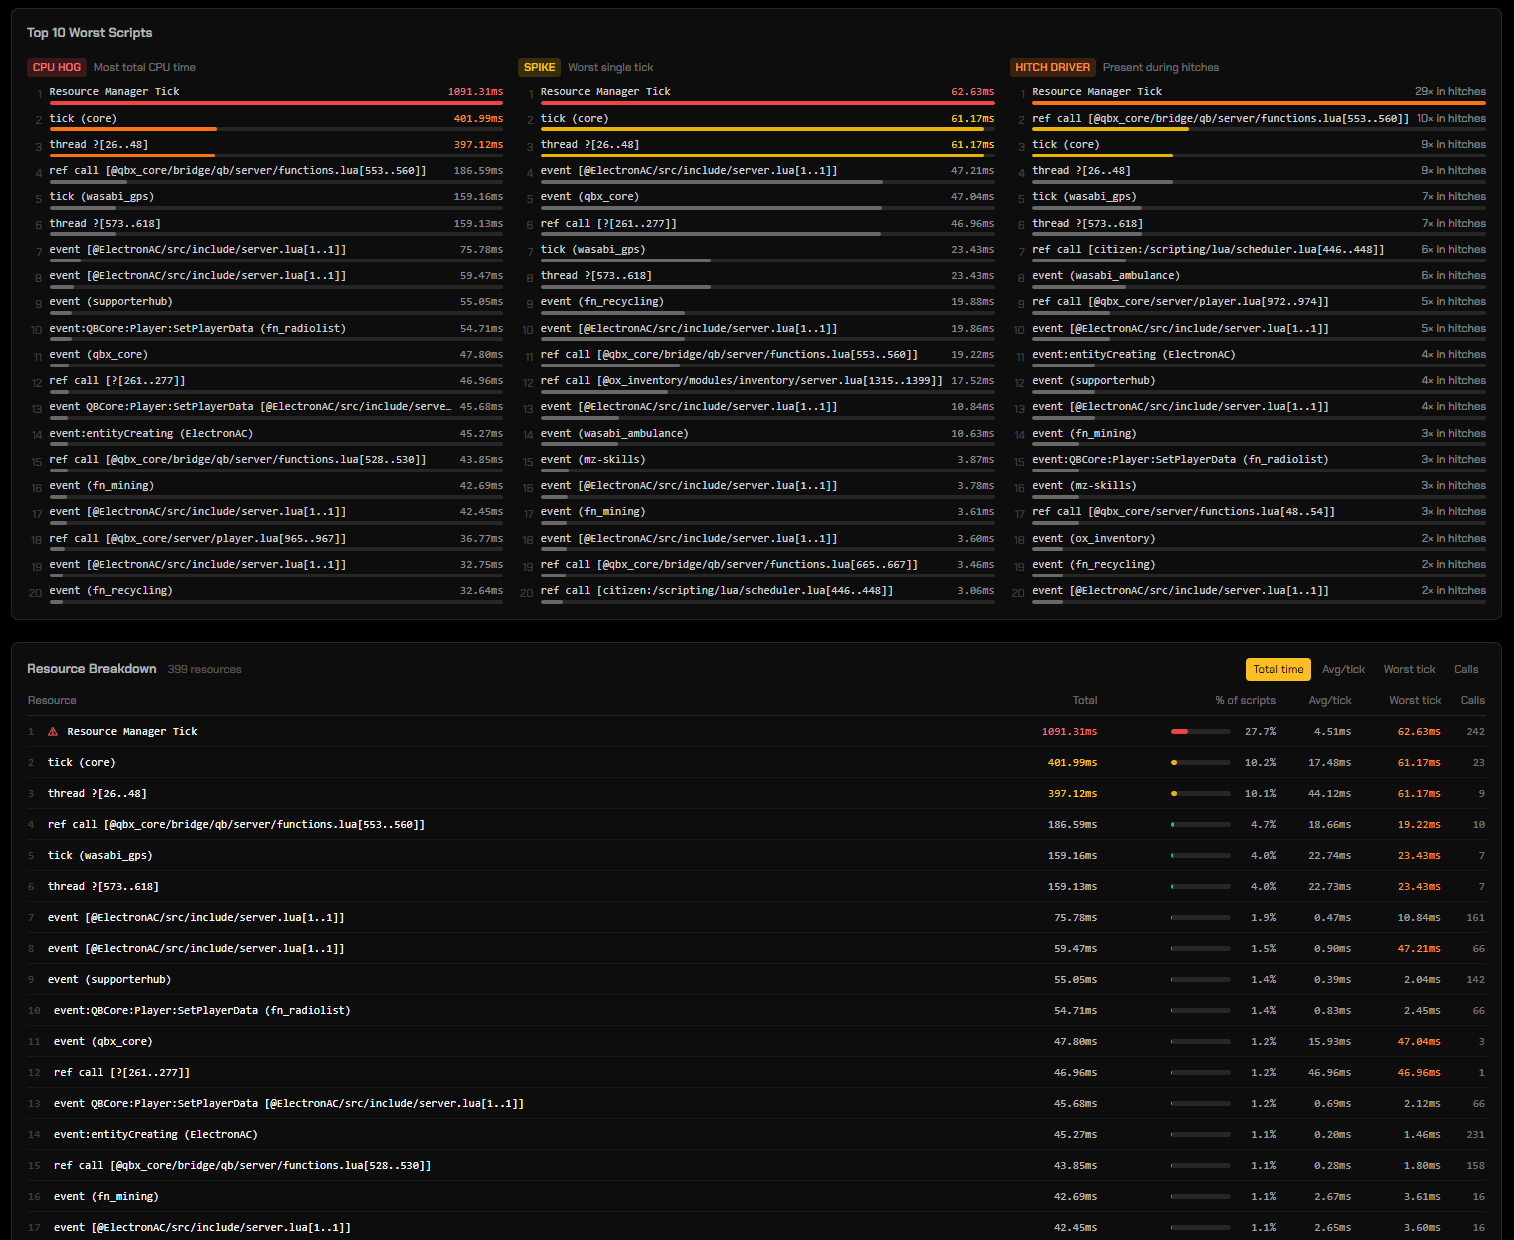
Top 20 worst scripts in three categories:
-
CPU HOG — most total CPU time across the whole recording.
-
SPIKE — worst single tick. A script can look fine on average but hit hard once in a while. Database queries, loops over all players, that sort of thing. This category is usually what players actually feel.
-
HITCH DRIVER — scripts that kept showing up during your heaviest ticks. Not always the biggest user but consistently present when things go wrong.
-
Next steps section that tells you what to actually do based on your results.
Top Offenders
There is a public leaderboard at Top Offenders – 1of1 Profiler that pulls from all shared profiles. You can see which scripts show up most across different servers, how heavy they are on average, and what their worst recorded tick was. Good for checking if a script is known to be heavy before you add it to your server.
One thing to know
This works well for Lua scripts. C# resources show limited detail because the .NET runtime batches multiple events into one trace entry and GC pauses show as a single unexplained spike. That is a FiveM limitation, not something the tool can fix.
The profiler file sometimes saves without a .json extension. The tool handles that fine.
Feedback please post below, happy to take a look and implement new features!