my server lately goes to 4%, which is good. It is a VPS in linux with the ubuntu server distribution.
But, today I don’t know what happened and from 6% it went to 98%, happening out of nowhere, it’s a strange event.
A colleague of mine recommended me to monitor.
I thought of a ddos attack, so I checked the connected ip’s and there was nothing but ours playing.
So, I thought server consumption, some loop. But of course, how can I see it?

This would be the example on the client side, obviously it already exists.
But what about the server side?
1 Like
Hey! To check this simply type svgui in ur console, then go to the new tab that will open on ur vds and enable resource monitor.
1 Like
Which ESX version are you running, 1.35 seems quite high compared to what we are used to seeing 
1 Like
Do not worry about the version or the consumption of ESX, it is like this because of some things that I have modified, my server only has 40 resources.
I was reading that in the documentation, but do you have any examples?

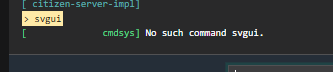
I am trying and it gives me this error
1 Like
svgui is not a valid command
U should try to do that in the server console (not in-game but on your host).
I see it also dont work for me.
Here are the docs. IDK if it’s removed or something.
1 Like
To my knowledge it’s a windows only feature. (Sadly because I’m using linux too)
You’re right, I just tried it local on windows and if it will open another window. But, that is of no use to me, my server is on linux.
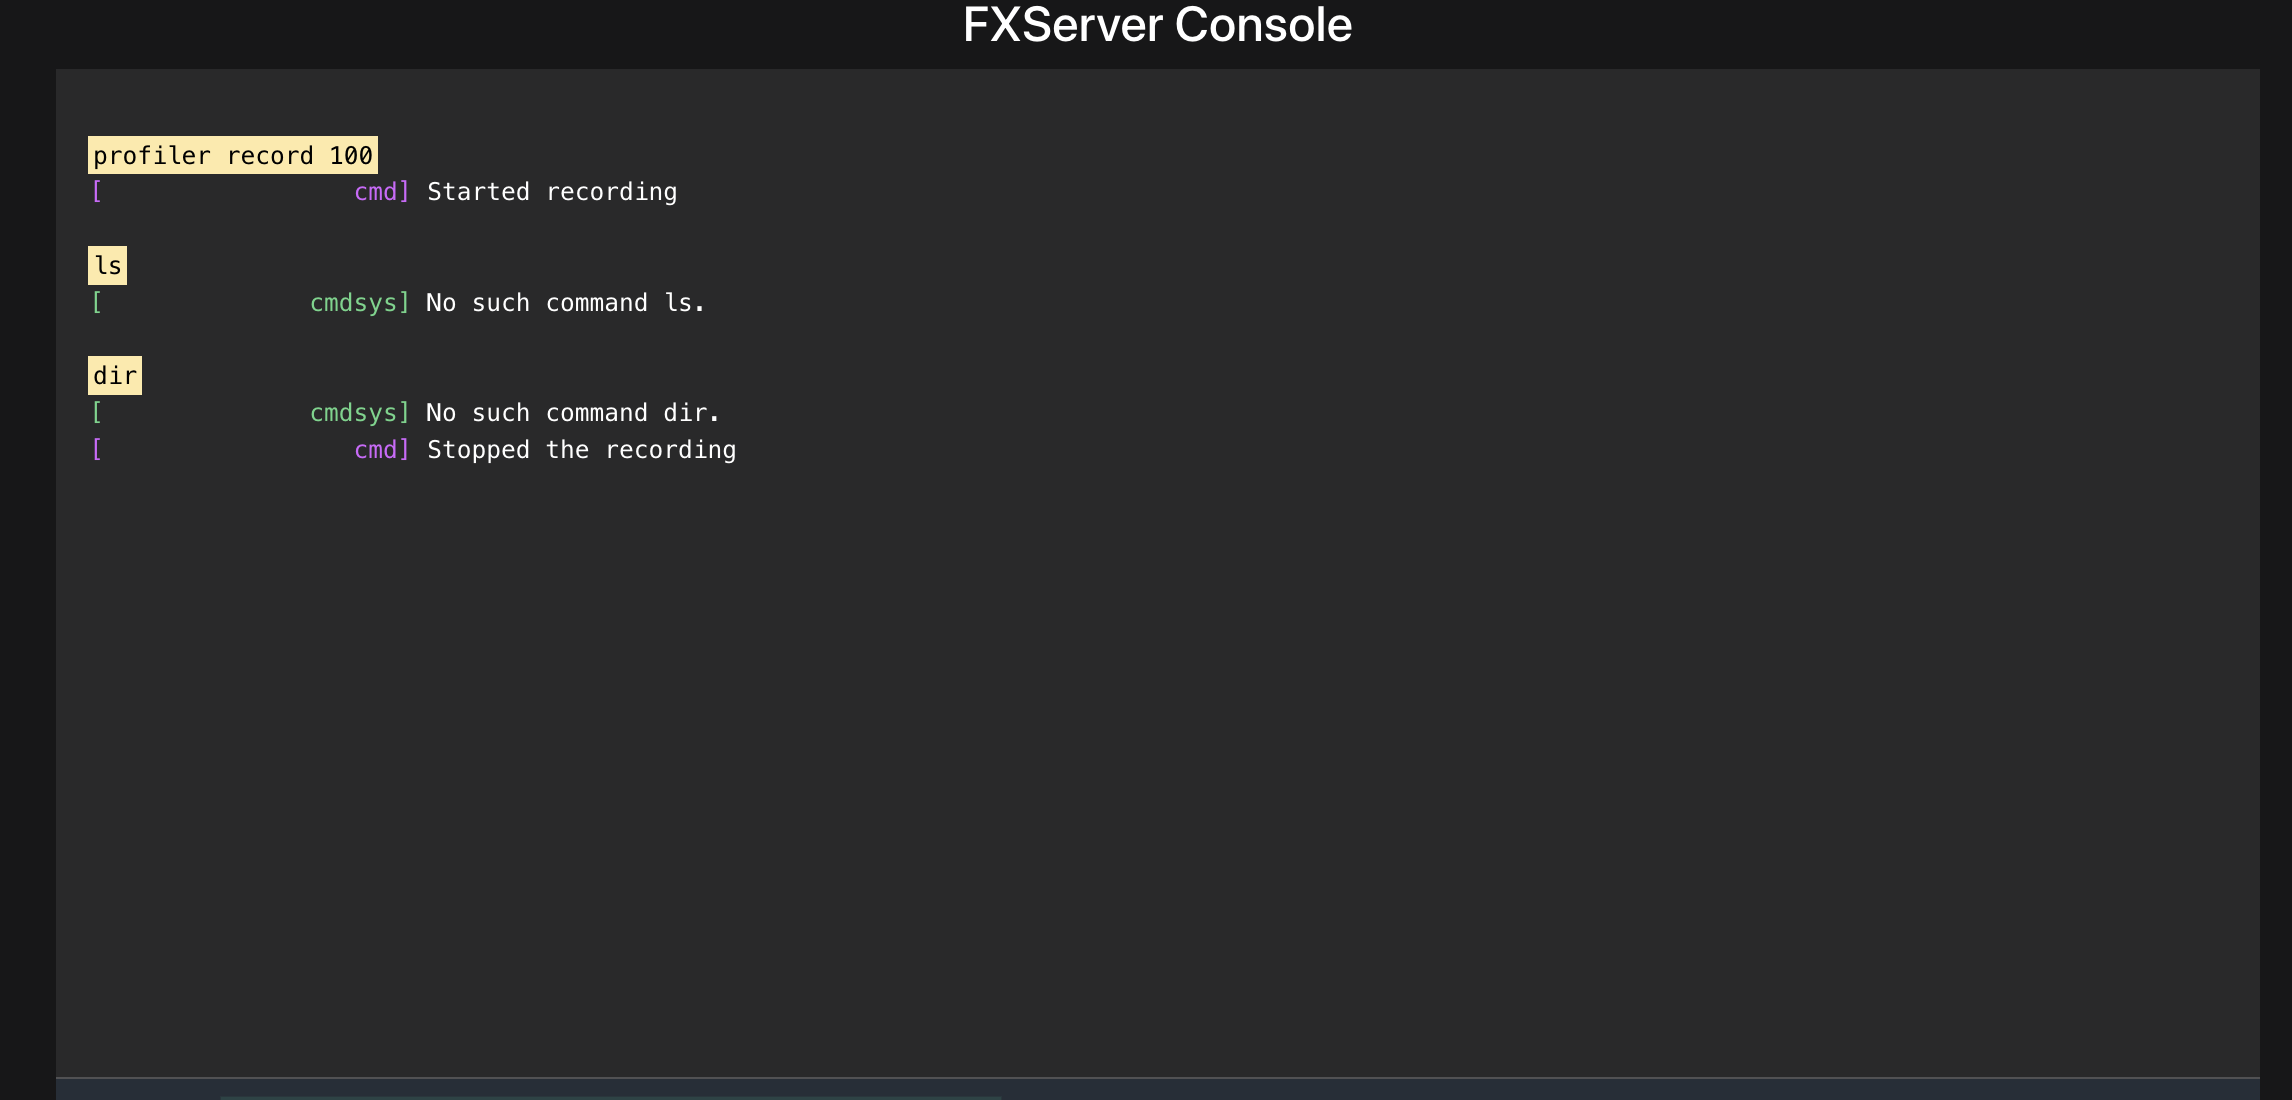
profiler exists on both platforms although you have to explicitly start/stop a recording.
4 Likes
I did not understand
1 Like
Take a look at this : Using the profiler - Cfx.re Docs
Thank you very much, now it works!
1 Like
this is exactly what I have been looking for! thank you!